Extra Report Pad مفكرة المتداولين. هذه لوحة إحصائيات توفر تحليلًا لحساب التداول الخاص بك لمنصة MetaTrader (ميتاتريدر).
يتم عرض نتائج التحليل على الرسم البياني في الوقت الفعلي. يحظى التداول متعدد العملات بشعبية كبيرة. ومع ذلك، كلما زاد عدد الصفقات، أصبح تحليل ربحية كل صفقة أكثر صعوبة. يعد التحليل الاحترافي للصفقات حسب الشهر وحساب الإحصائيات لكل صفقة مهامًا أكثر صعوبة. توفر لوحة Extra Report Pad حلاً فعالاً لتحليل حسابك وإعداد إحصائيات مفصلة في الوقت الفعلي بتنسيق HTML، أو CSV، أو على الرسم البياني. مثل MyFxBook إذا كنت تتطلع إلى الحصول على فهم شامل لأداء نظام التداول الخاص بك، فهناك العديد من الأدوات المتاحة التي يمكن أن تساعدك في تحقيق هذا الهدف. يتضمن Extra Report Pad تقارير، وإحصائيات، وmyfxbook، وسجلات التداول، وتحليل الحساب، وإحصائيات الأداء، وتحليلات، ولوحة تحكم مبتكرة. باستخدام Extra Report Pad، يمكنك تحليل أداء نظام التداول الخاص بك بتفصيل كبير والحصول على رؤى قيمة حول مجالات القوة ونقاط الضعف المحتملة.
سواء كنت متداولًا جديدًا تتطلع إلى تحسين أدائك أو متداولًا متمرسًا يسعى إلى تحسين استراتيجية التداول الخاصة بك، يمكن أن يوفر لك Extra Report Pad المعلومات التي تحتاجها لاتخاذ قرارات مستنيرة وتحقيق أهدافك المالية.
كيف يعمل Extra Report Pad؟
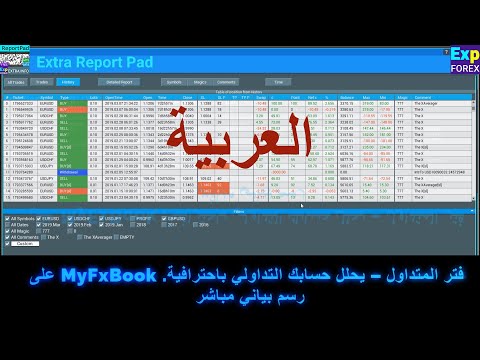
Extra Report Pad Trader’s Diary – يحلل حساب التداول الخاص بك بشكل احترافي. MyFxBook في الرسم البياني المباشر
الوظائف الرئيسية لـ Extra Report Pad-
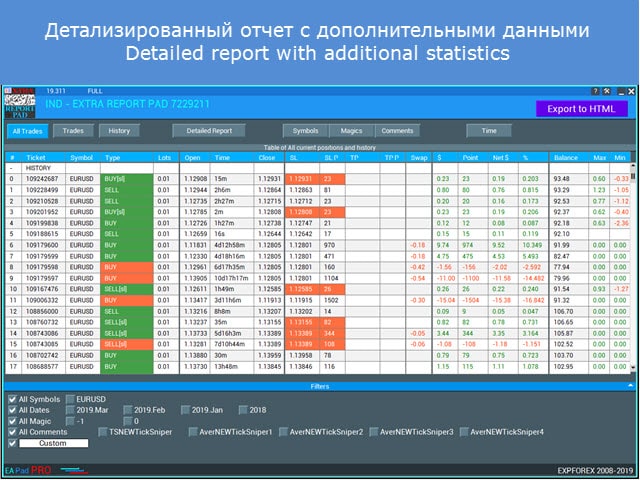
Extra Report Pad تقرير مفصل عن الصفقات/الأوامر المغلقة في وضع الاتصال بالإنترنت
Extra Report Pad تصفية الصفقات حسب التاريخ، الرمز، الرقم السحري (Magic)، التعليق
Extra Report Pad رسم بياني للربحية وتقرير الحساب الحالي
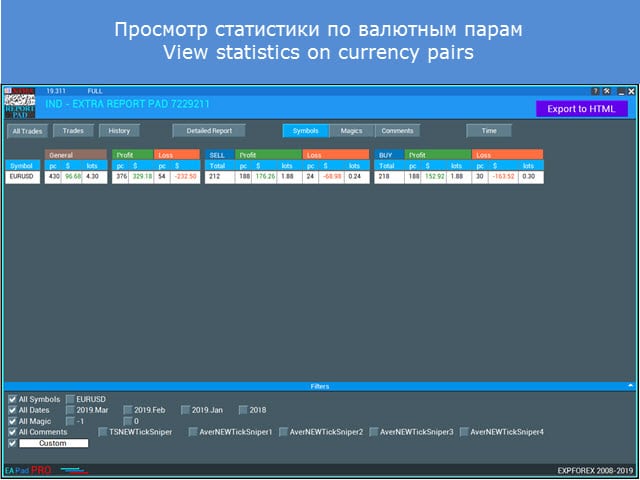
Extra Report Pad تقرير عن كل رمز
Extra Report Pad تقرير عن كل رقم سحري
Extra Report Pad تقرير عن كل تعليق
Extra Report Pad تصدير التقرير إلى HTML و CSV
Extra Report Pad إحصائيات حسب الفترة الزمنية
Extra Report Pad: عرض الإحصائيات حسب الأوقات
Extra Report Pad: Detailed report with filters
Extra Report Pad: حفظ التقرير المفصل إلى HTML
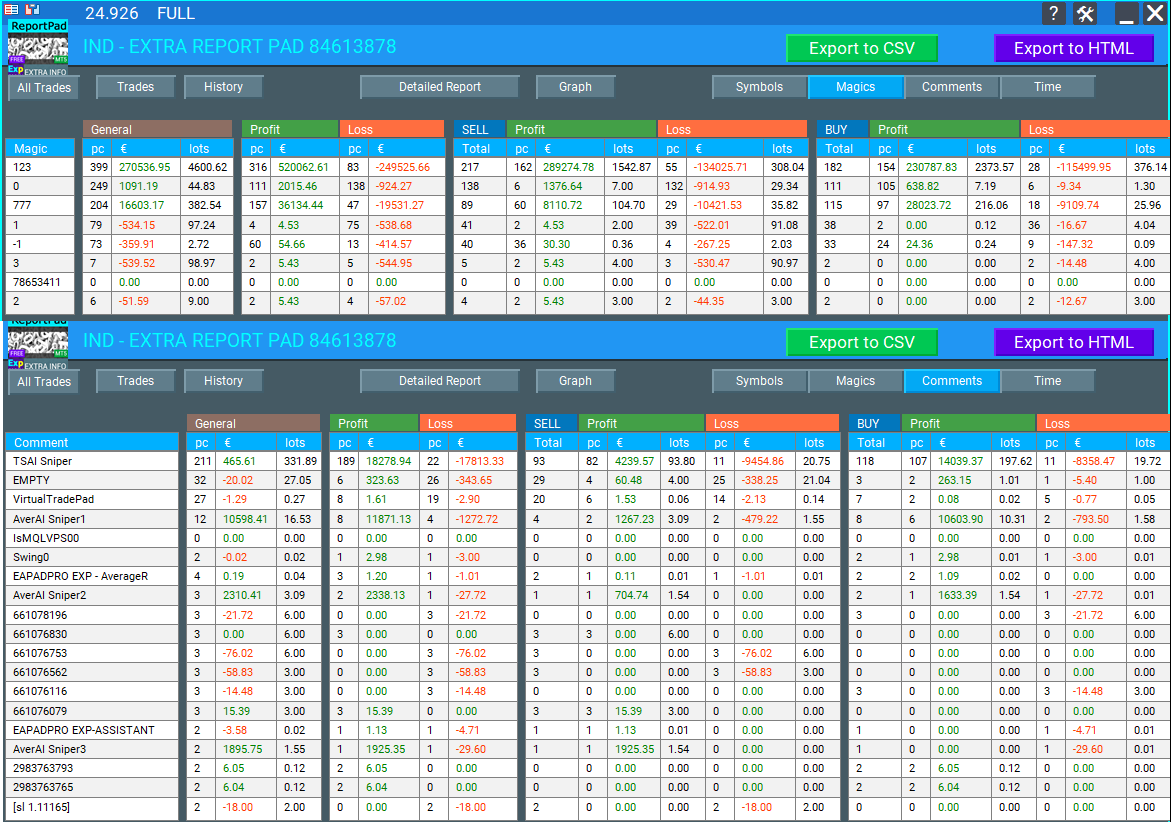
Extra Report Pad: عرض الإحصائيات حسب الأرقام السحرية
Extra Report Pad: عرض الإحصائيات حسب الرموزExtra Report Pad: عرض الإحصائيات حسب الرموز
cbarryftmo
At last, I've discovered exactly what I needed! I'd been searching for a tool to assess the performance of various EAs over time, but couldn't find one. The program I downloaded earlier lacked the feature to label prices traded by specific EAs. This tool fulfills my requirement perfectly. I'm extremely grateful for the expertise behind its development and the superior ability to download information. Thank you so much!
This indicator is amazing. It also has the max upside watermark and the lowest drawdown that was in profit per trade. Compare it to the actual profit or loss, then use an EA like Account Protector and tell it to take profit or stop loss at the average high watermark and stop loss at at the lowest above the largest drawdowns. It will increase your profits and mimimize your losses. just review your trades daily or weekly and you will find this tool invaluable. And the reports are far better than Metatraders. And it gives you a report analysis of all your trades with win and lose rate, profit ration, lowest overall drawdown, etc. You can also filter your trades by comment or magic number to get a drilled down deeper insight. Great job author!
Jcb Mlwijk
Excellent reporting functionality that provides you with detailed insights into their trading performance. The tool generates trade history reports, including key metrics such as profit/loss analysis, drawdown, and risk exposure.
Fabrizio Malavasi
This reporting app it's a very useful tool to analyse the trades order history.The "Time" button that show the profit/entry along the time It's interesting too. It has a very nice graphic form. You made as usual an excellent job!
Thanks a lots!
Yusuf Mansawala
It's a useful tool for Fund Mangers and Clients trading with multiple signals or multiple copy trading services, as it can sort out your account statement into a powerful decision making tool.
hwschmidt
Tolles Tool. Sehr viele Informationen die man bisher nicht hatte. Für mich besonders gut weil ich die Daten jetzt besser nach Excel übertragen kann ohne das die Formatierung leidet. Danke
Extra Report Pad هو حل احترافي لـتحليل حساب التداول الخاص بك بفعالية.
تقوم مفكرة المتداول بتحليل حساب التداول الخاص بك بشكل احترافي، على غرار MyFxBook مع الرسوم البيانية الحية.
اليوم، من الضروري تداول عدة أزواج عملات في وقت واحد.
Extra Report Pad هو أداة احترافية لتحليل حساب التداول الخاص بك. تقوم مفكرة المتداول بتحليل حساب التداول الخاص بك بشكل احترافي على الرسوم البيانية الحية، تمامًا مثل MyFxBook.
ومع ذلك، كلما زاد عدد الصفقات التي تقوم بها، أصبح التحليل الاحترافي لربحية حسابك أكثر صعوبة.
يصبح تحليل الصفقات حسب الشهر أكثر صعوبة.
علاوة على ذلك، فإن حساب البيانات الإحصائية لكل صفقة على حدة يمثل تحديًا أكبر.
وجدنا حلاً: يمكن للوحتنا أن تحلل حسابك بشكل احترافي وتجمع الإحصائيات بأكبر قدر ممكن من التفاصيل في الوقت الفعلي.
مؤشر لجمع وتحليل حساب التداول الخاص بك.
مقدمة
منذ بداية عملنا في الفوركس (Forex)، مر الكثير من الوقت، وجعلنا التداول في سوق الفوركس ننشغل بمهام مثل تحليل حساب التداول. هذا صحيح بشكل خاص للخبراء الذين يعتمدون على الأنظمة الآلية.
يعد تحليل أزواج التداول المربحة بناءً على تقرير MetaTrader القياسي أمرًا صعبًا للغاية. فهو لا يحتوي على بيانات مفصلة عن الصفقات، ناهيك عن البيانات المتعلقة بأزواج العملات المربحة والإحصاءات الشهرية.
يمكنك مراقبة حسابك باستخدام إحدى الخدمات لجمع الإحصائيات، ولكنها ليست مريحة تمامًا.
بعد الاختبار على مدى فترة شهر، كان علينا تشريح التقرير يدويًا لتحديد الأزواج المربحة وغير المربحة — وبناءً على البيانات، لتحسين النظام بشكل أكبر.
وجدنا حلاً لهذه المشكلة وأنشأنا مؤشر EXTRA REPORT PAD، القادر على تحليل حسابك بشكل احترافي تلقائيًا وعرض معلومات مفصلة في الوقت الفعلي!
الفوائد
تم تصميم مؤشرنا لتحليل تداول الفوركس في الوقت الفعلي. استخدم إحصائيات شاملة وجميع البيانات التي يمكن استخلاصها من منصة MetaTrader!
MyFxBook Mini مدمج في نافذة المنصة الخاصة بك وهو دائمًا في متناول يدك!
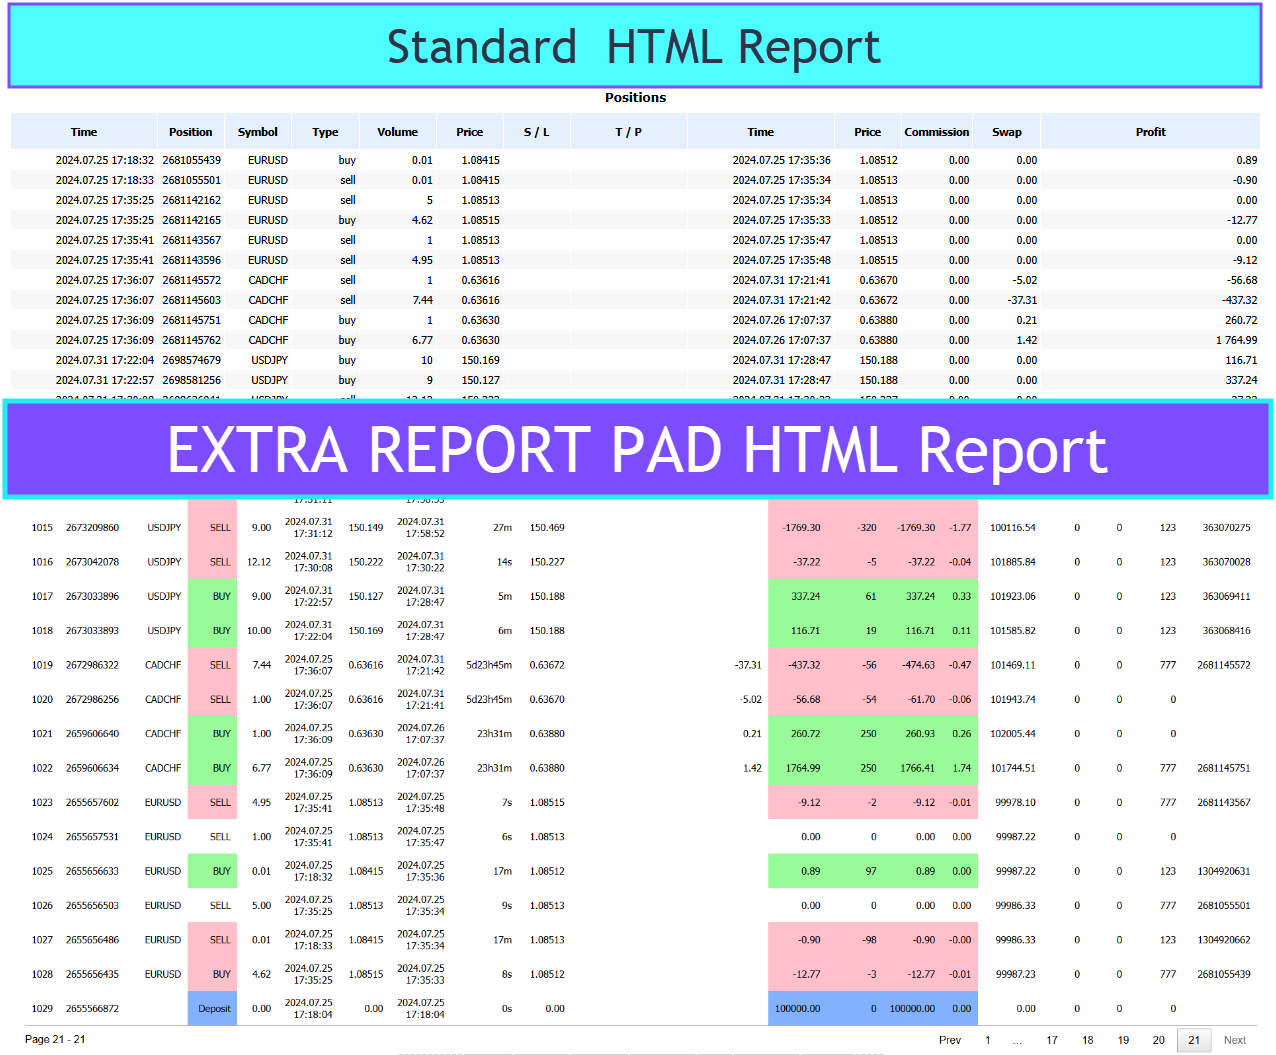
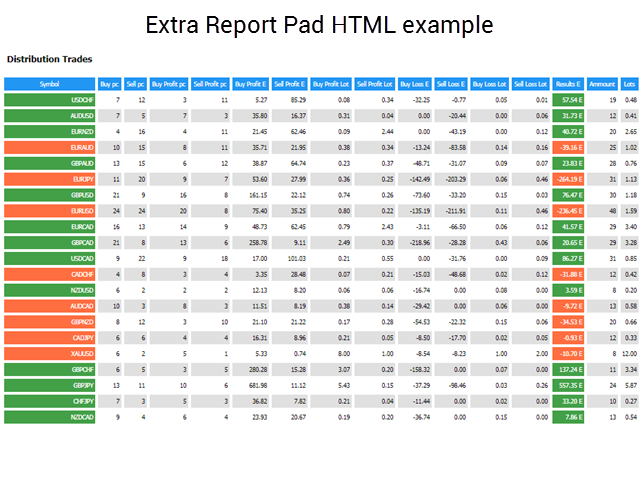
يحتوي التقرير المفصل الذي تم تحميله بتنسيق HTML على معلومات أكثر بنسبة 500% من تقرير MT القياسي.
تقرير MetaTrader المفصل القديم
تقرير مفصل جديد تم إنشاؤه بواسطة Extra Report Pad
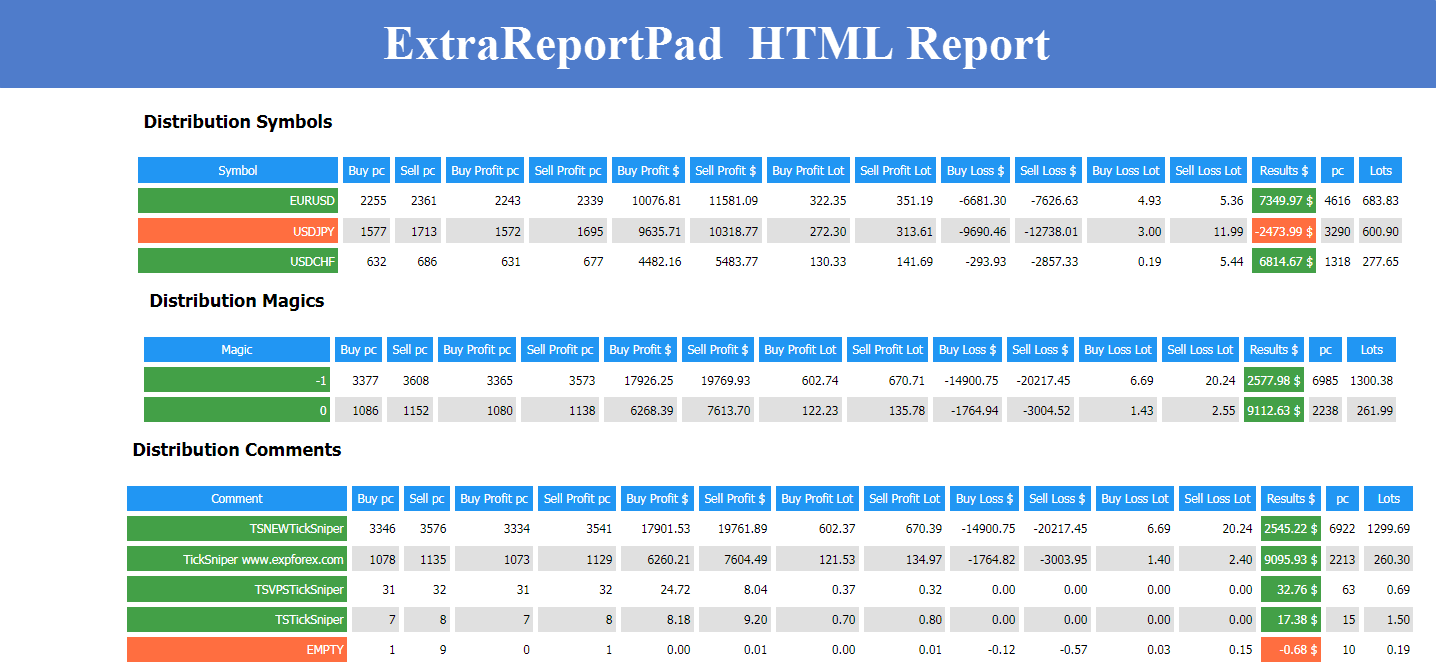
التصدير إلى HTML و CSV
أضفنا زر EXPORT to HTML إلى Extra Report Pad، والذي يقوم بتصدير التقرير بالكامل من الرسم البياني إلى ملف HTML منفصل. يتم تصفية جميع الصفقات وفقًا للمرشحات المستخدمة في اللوحة. على سبيل المثال، يمكنك تحديد زوج عملات واحد فقط، أو رقم سحري (Magic Number) معين، أو شهر معين. سيحتوي التقرير الذي تم إنشاؤه على البيانات التي تمت تصفيتها فقط.
لفتح تقرير HTML المفصل الخاص بك:
افتح مجلد البيانات.
يتم إنشاء ملف التقرير في المجلد: YOUR TERMINAL \ MQL4 \ Files \ EXTRAREPORTPAD \ EXTRAREPORTPAD AccountNumber.html
مثال على HTML:
مثال على CSV:
علامات التبويب وعناصر التحكم
تتكون لوحتنا حاليًا من 9 علامات تبويب:
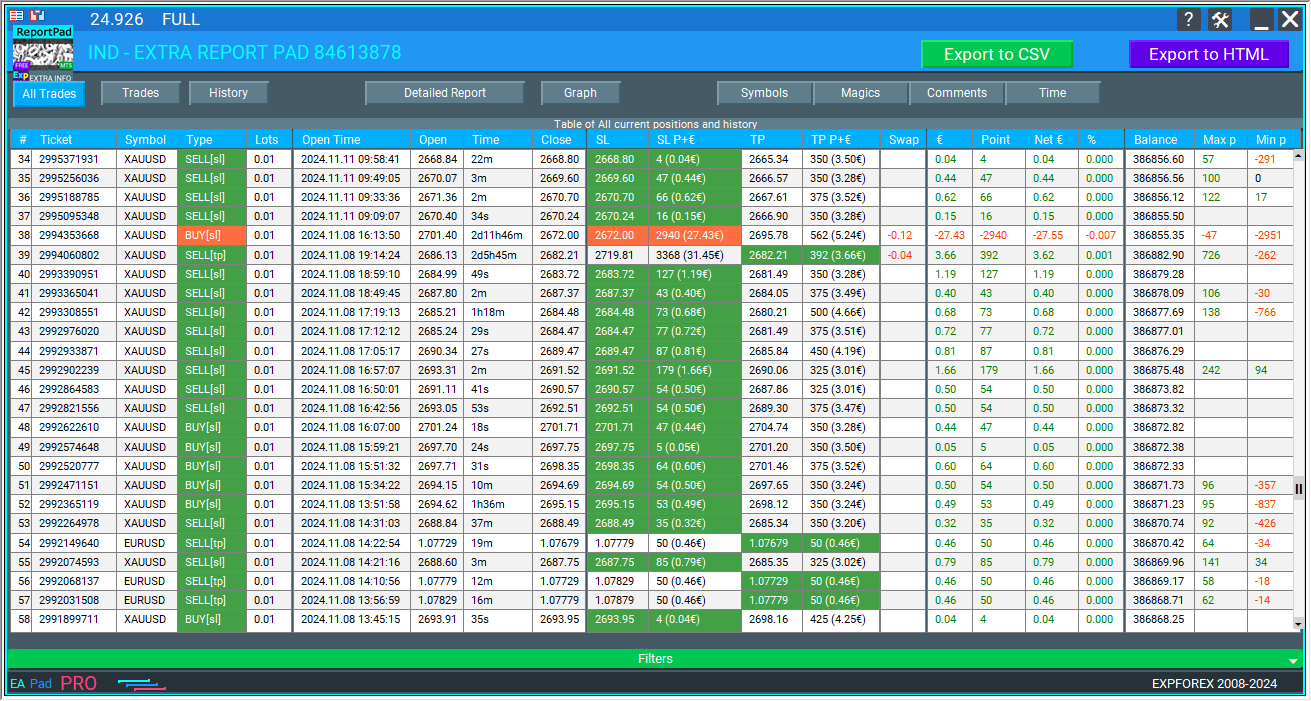
TRADES (صفقات) – يعرض الصفقات المفتوحة الحالية.
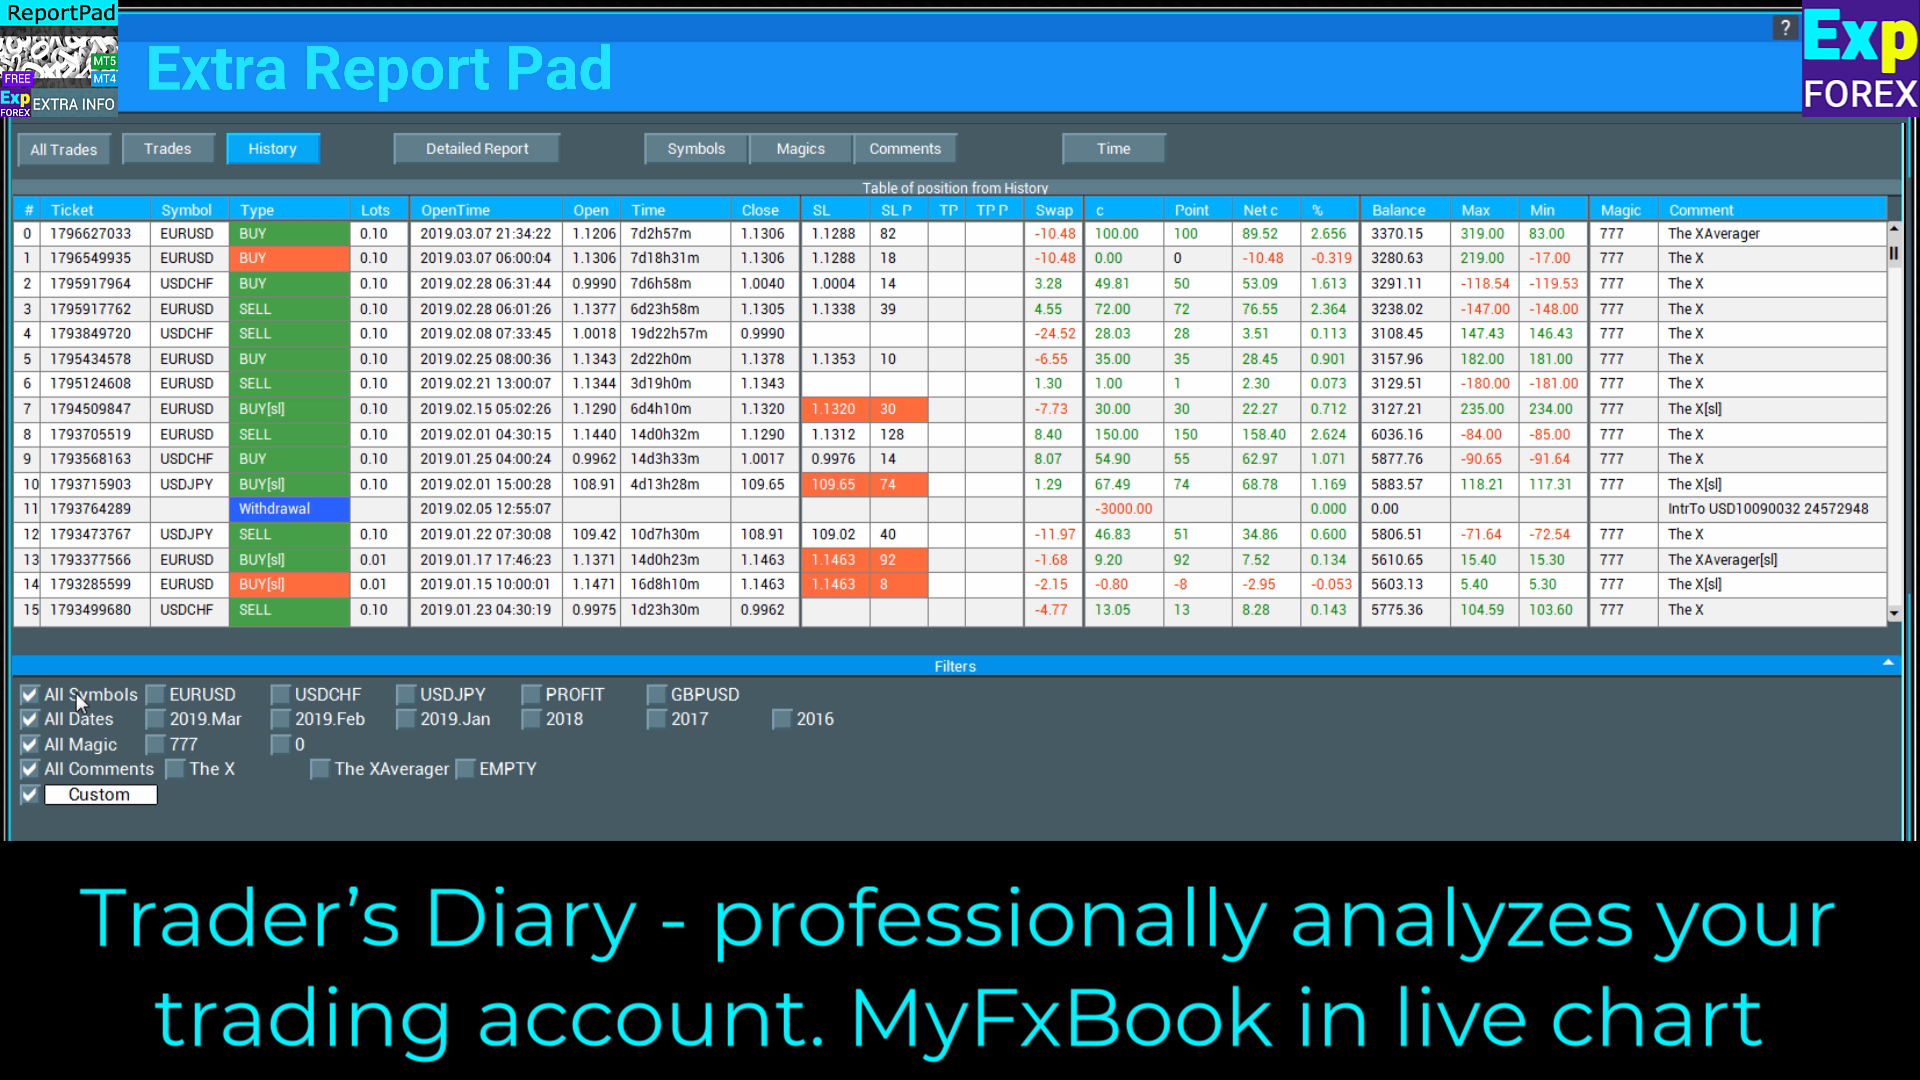
HISTORY (السجل) – يعرض الصفقات المغلقة من السجل.
ALL TRADES (جميع الصفقات) – يعرض كلاً من الصفقات المفتوحة والمغلقة.
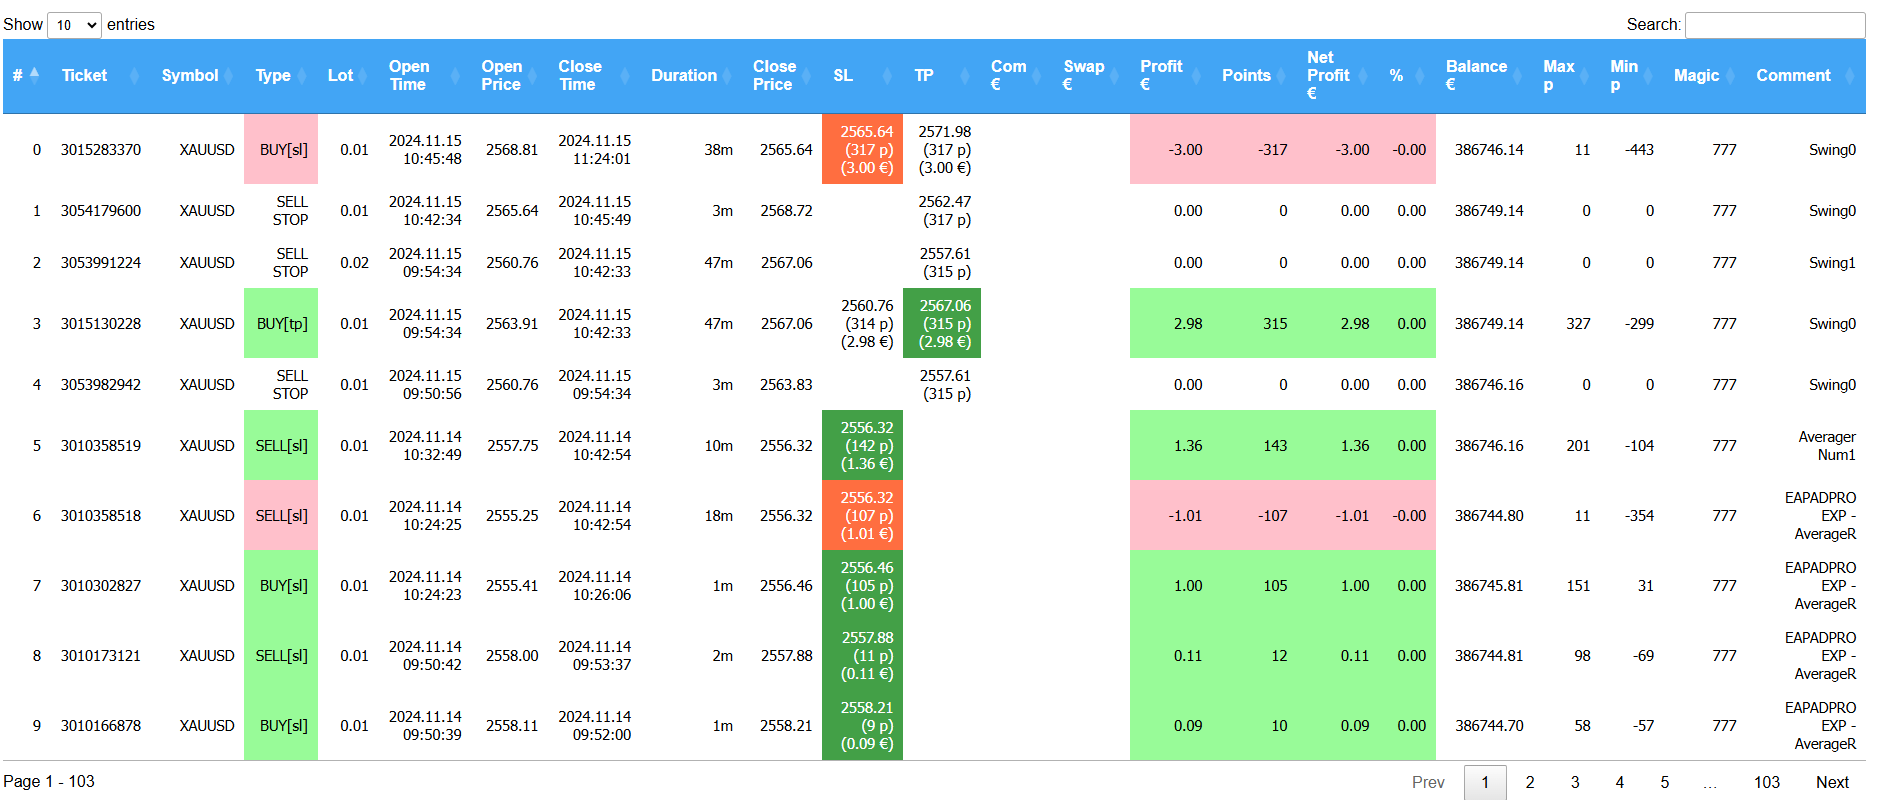
REPORTS (تقارير) – يعرض تقريرًا مفصلاً عن الصفقات المغلقة لحساب التداول الخاص بك.
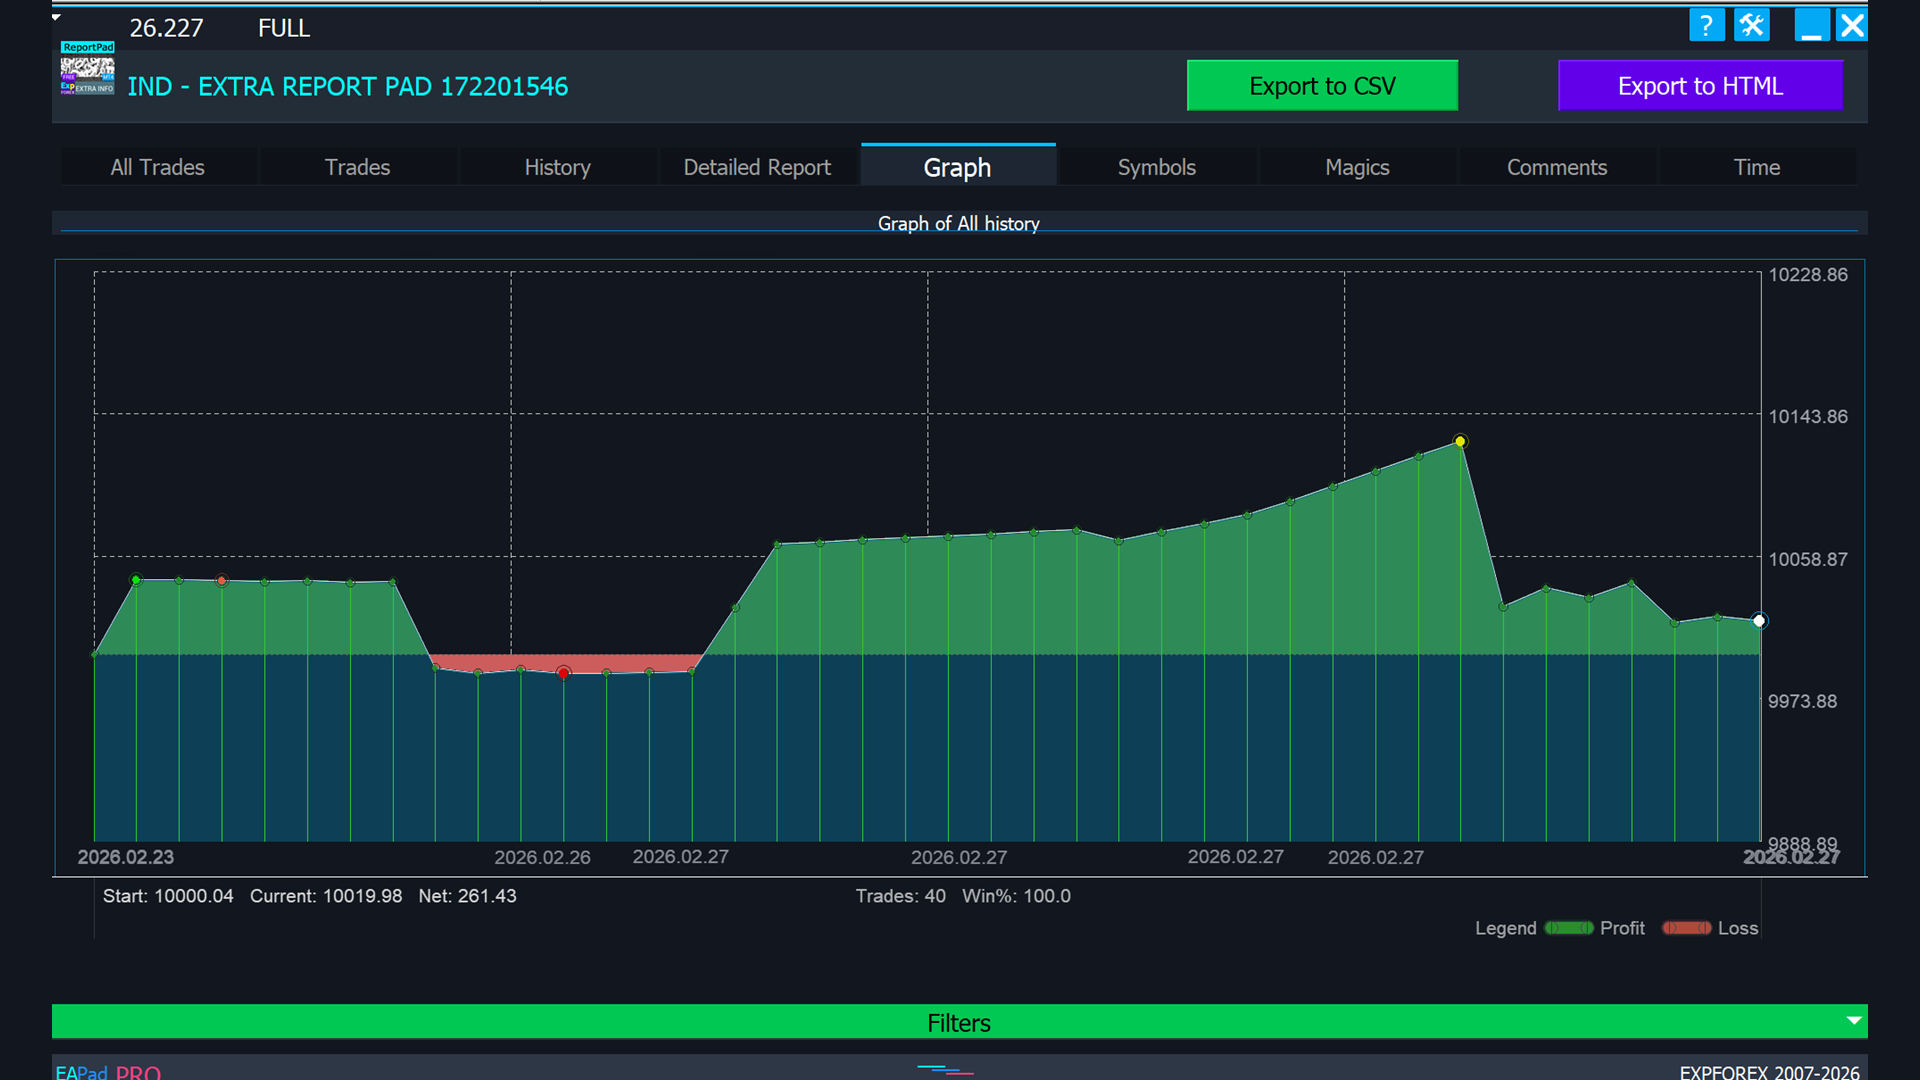
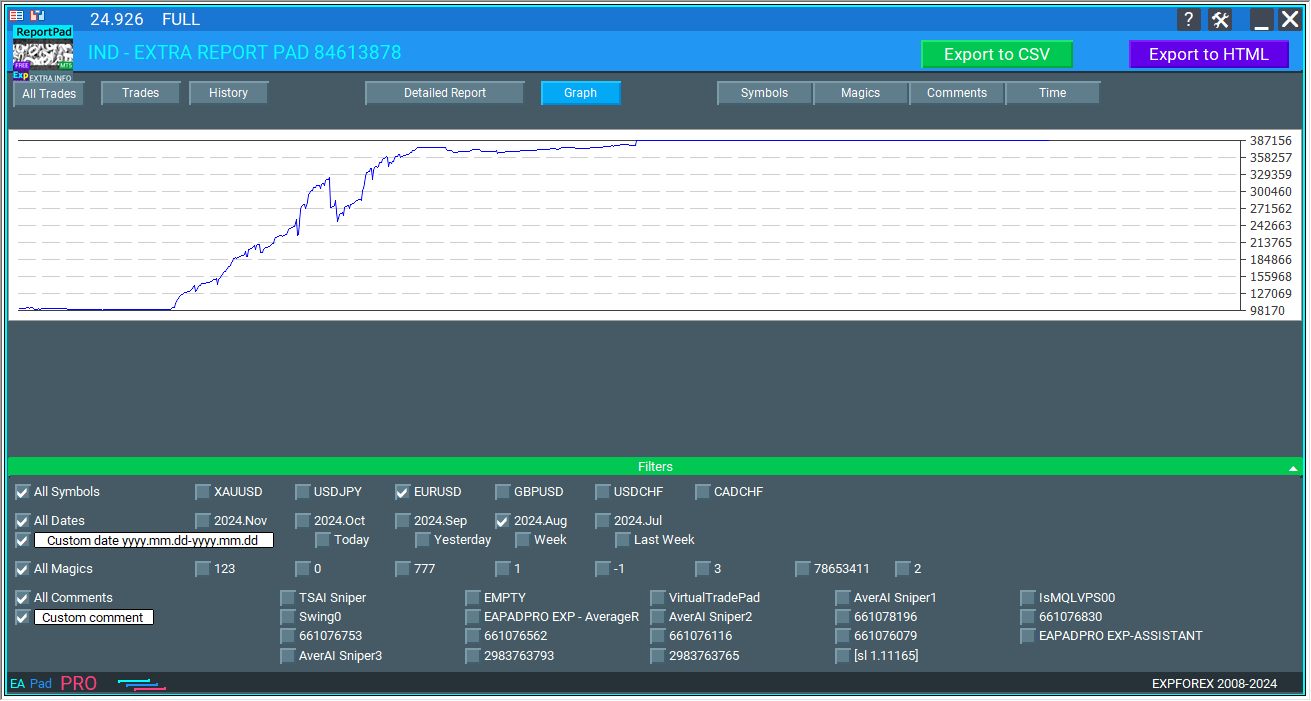
GRAPH PROFIT CHART (رسم بياني للأرباح) – يوفر تمثيلاً مرئيًا لاتجاهات الربح بمرور الوقت، مما يتيح لك تقييم الربحية الإجمالية لصفقاتك ورؤية الأنماط أو التقلبات في أداء التداول الخاص بك.
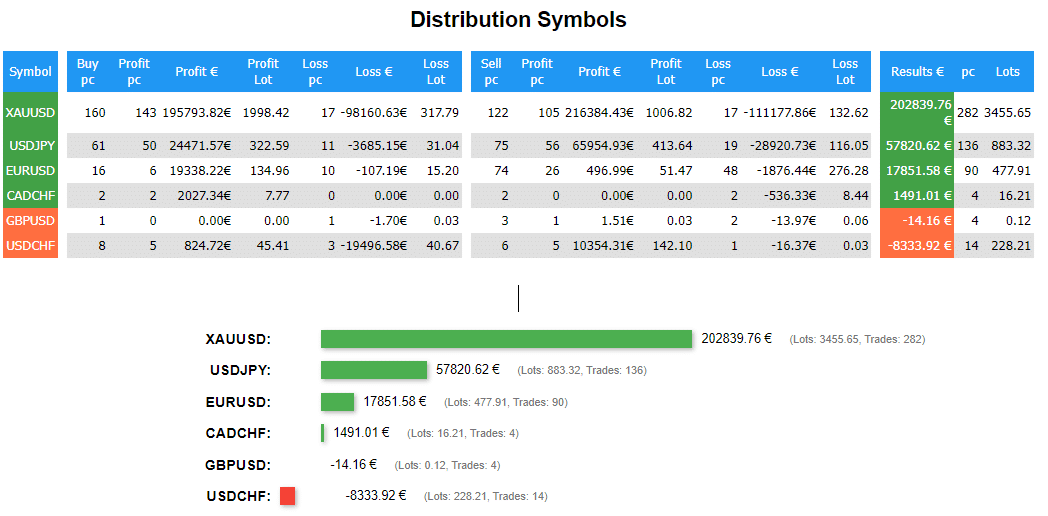
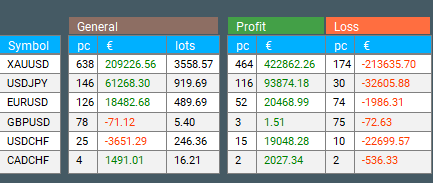
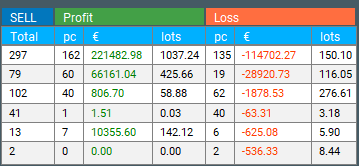
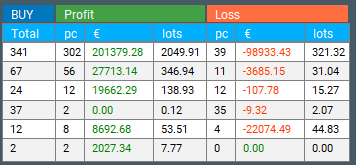
DISTRIBUTION Symbols (توزيع الرموز) – يعرض توزيع صفقات الشراء (BUY) والبيع (SELL) مع العدد الإجمالي، وكذلك عدد الصفقات المربحة لكل زوج عملات على حدة. كما يعرض توزيع الصفقات المربحة، وإجمالي ربحها، وحجم العقد (Lot Size) لكل زوج عملات بشكل فردي، وكذلك توزيع الصفقات الخاسرة لكل رمز.
DISTRIBUTION by Comments (توزيع حسب التعليقات) – يعرض توزيع الصفقات المصنفة حسب تعليقات محددة، بما في ذلك العدد الإجمالي لصفقات الشراء والبيع، والصفقات المربحة، وإجمالي ربحها، وحجم العقد بناءً على كل تعليق فريد. كما يعرض توزيع الصفقات الخاسرة لكل فئة تعليق.
DISTRIBUTION by Magic Numbers (توزيع حسب الأرقام السحرية) – يعرض توزيع الصفقات المصنفة حسب الأرقام السحرية، مع تفصيل العدد الإجمالي لصفقات الشراء والبيع، والصفقات المربحة، وإجمالي ربحها، وحجم العقد لكل رقم سحري بشكل فردي. كما يعرض توزيع الصفقات الخاسرة لكل رقم سحري.
DISTRIBUTION Time (توزيع الوقت) – يعرض عدد الصفقات، وكذلك الربح أو الخسارة حسب الساعات وأيام الأسبوع والأشهر. من خلال النظر إلى أسماء الأعمدة، يمكنك الحصول على بيانات لكل فئة.
تم بناء لوحتنا على قالب محسّن من لوحات التداول VIRTUALTRADEPAD و EAPADPRO، لذا تتكرر بعض العناصر.
انتباه! لعرض جميع المراكز من سجل الحساب، تحتاج إلى تحديد علامة تبويب سجل الحساب بالكامل في سجل الحساب.
انتقل إلى علامة تبويب سجل الحساب وانقر بزر الماوس الأيمن – حددكل السجل (All History).
حجم الخط، تصغير وإغلاق اللوحة. الإعدادات
يمكنك تغيير حجم خط اللوحة مباشرة على اللوحة نفسها، وكذلك طي اللوحة وإغلاقها.
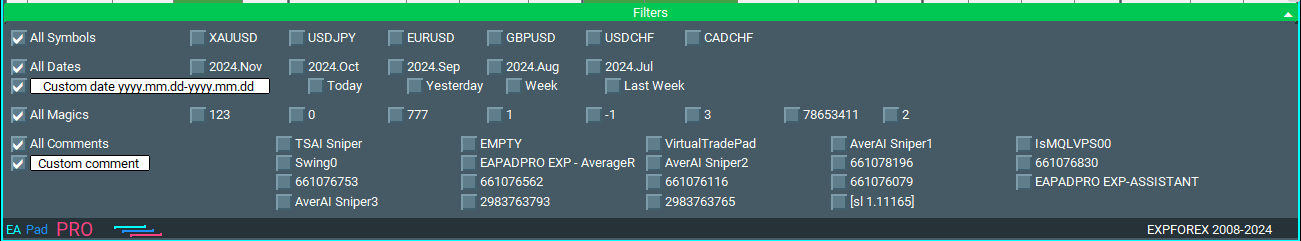
في كل علامة تبويب، يمكنك تصفية الإحصائيات حسب التوفر، السجل، أزواج العملات، شهر التداول، والرقم السحري. بالإضافة إلى ذلك، يمكنك استخدام تاريخ مخصص وتعليق مخصص.
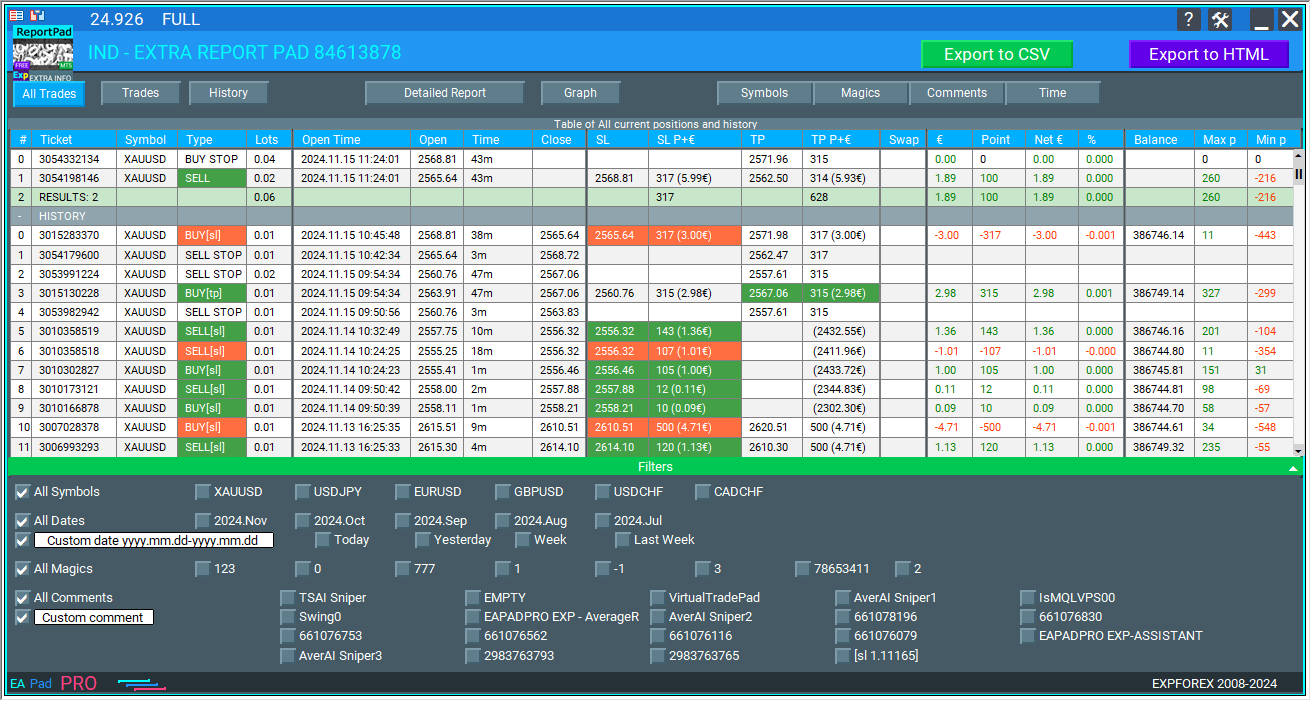
علامة تبويب TRADES (الصفقات)
تعرض علامة التبويب هذه الصفقات المفتوحة الحالية، وفي المتغيرات الخارجية، يمكنك تحديد أنواع الأعمدة المراد عرضها.
يتوفر 21 عمودًا لعرض الإحصائيات.
Column_Number – يعرض رقم تسلسل الصفقة في التقرير؛
Column_Symbol – يعرض زوج العملات للصفقة؛
Column_Type – يعرض نوع الأمر [أي وقف تم تفعيله في هذه الصفقة]؛
Column_Lot – يعرض حجم عقد الصفقة (المركز)؛
Column_OpenTime – يشير إلى وقت فتح الصفقة؛
Column_OpenPrice – يشير إلى سعر فتح الصفقة؛
Column_CloseTime – يشير إلى وقت إغلاق الصفقة؛
Column_TimeBetween – يعرض وقت الاحتفاظ بالصفقة بالساعات والدقائق؛
Column_ClosePrice – يشير إلى سعر إغلاق الصفقة؛
Column_SL – يشير إلى وقف الخسارة (Stop Loss) للصفقة (يتم تمييزه إذا تم إغلاق الصفقة عند وقف الخسارة)؛
Column_TP – يعرض أخذ الربح (Take Profit) للصفقة (يتم تمييزه إذا تم إغلاق الصفقة عند أخذ الربح)؛
Column_Percent – يشير إلى النسبة المئوية لصافي الربح بالنسبة للرصيد وقت إغلاق الصفقة؛
Column_Magic – يعرض الرقم السحري للصفقة؛
Column_Comment – يعرض تعليق الصفقة (المركز)؛
Column_Balance – يعرض الرصيد الذي تم الحصول عليه بعد إغلاق الصفقة؛
Column_Max – يشير إلى أقصى انحراف لسعر الصفقة بعملة الإيداع؛
Column_Min – يشير إلى أدنى انحراف للسعر بعملة الإيداع؛
يرجى ملاحظة! يُظهر المعاملان Column_Max و Column_Min أقصى وأدنى ربح بعملة الإيداع. يتم إجراء التحليل عن طريق إيجاد أشرطة الدقيقة لزوج العملات. للحصول على بيانات أكثر دقة، تحتاج إلى تنزيل السجل الكامل لمخطط M1 لزوج العملات.
هنا، يمكنك أيضًا تصفية الصفقات حسب MagicNumber – Magics.
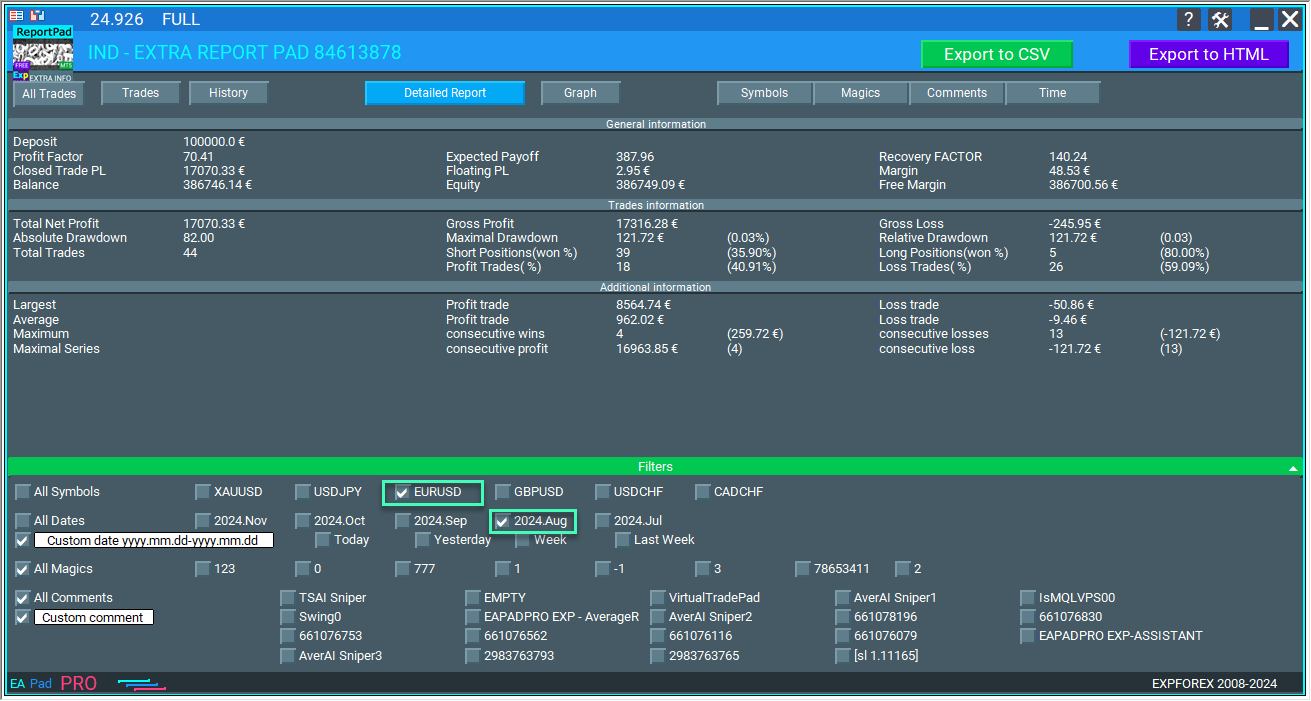
في الجزء السفلي من علامة التبويب هذه، لديك خيار إخفاء بعض أزواج العملات والتواريخ من الإحصائيات. للقيام بذلك، انقر فوق مربع الاختيار بجوار الاسم.
مهم! يجب عليك إلغاء تحديد (إزالة علامة الاختيار من) مربعات AllSymbols أو AllDates للتصفية حسب تواريخ أو أزواج عملات (رموز) محددة.
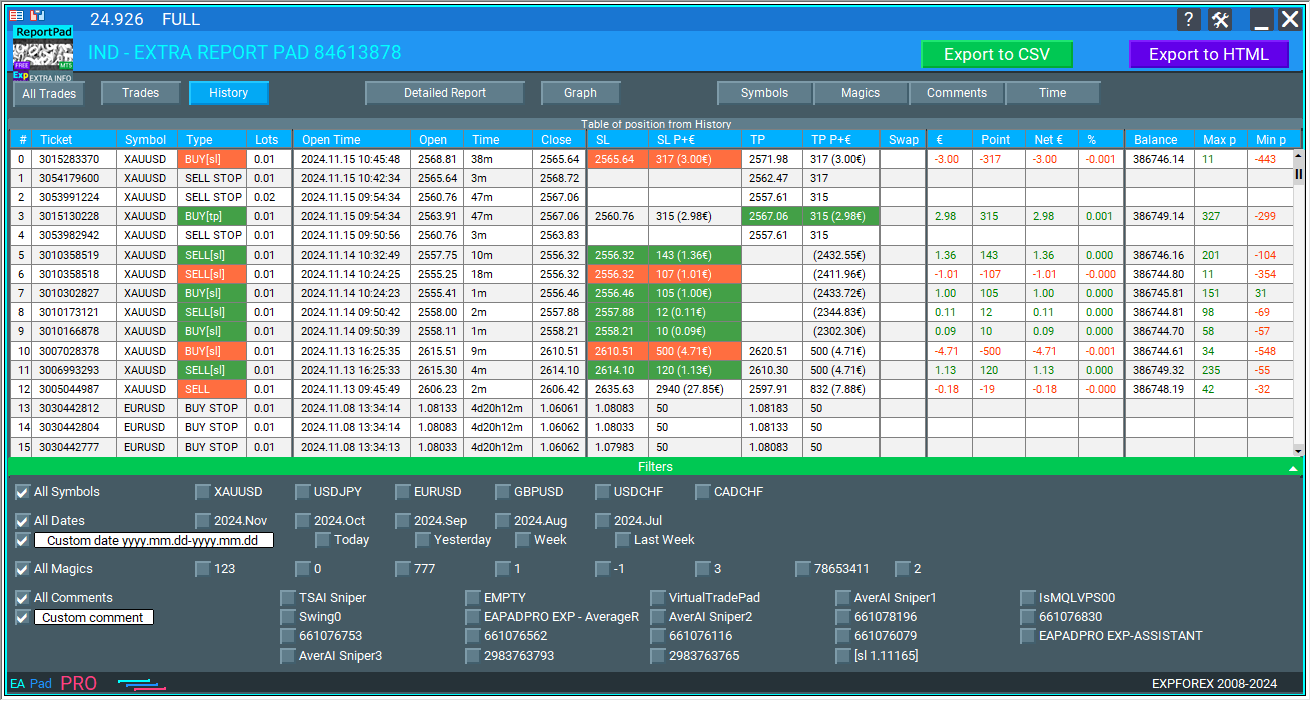
علامة تبويب HISTORY (السجل)
تعرض علامة التبويب هذه الصفقات المغلقة من السجل.
يمكن أيضًا تعديل الأعمدة ورؤيتها في الإعدادات.
مطابقة لعلامة تبويب TRADES (الصفقات).
يمكنك أيضًا التمرير عبر صفحات الإحصائيات إذا كان عدد الصفقات لا يتناسب مع الشاشة.
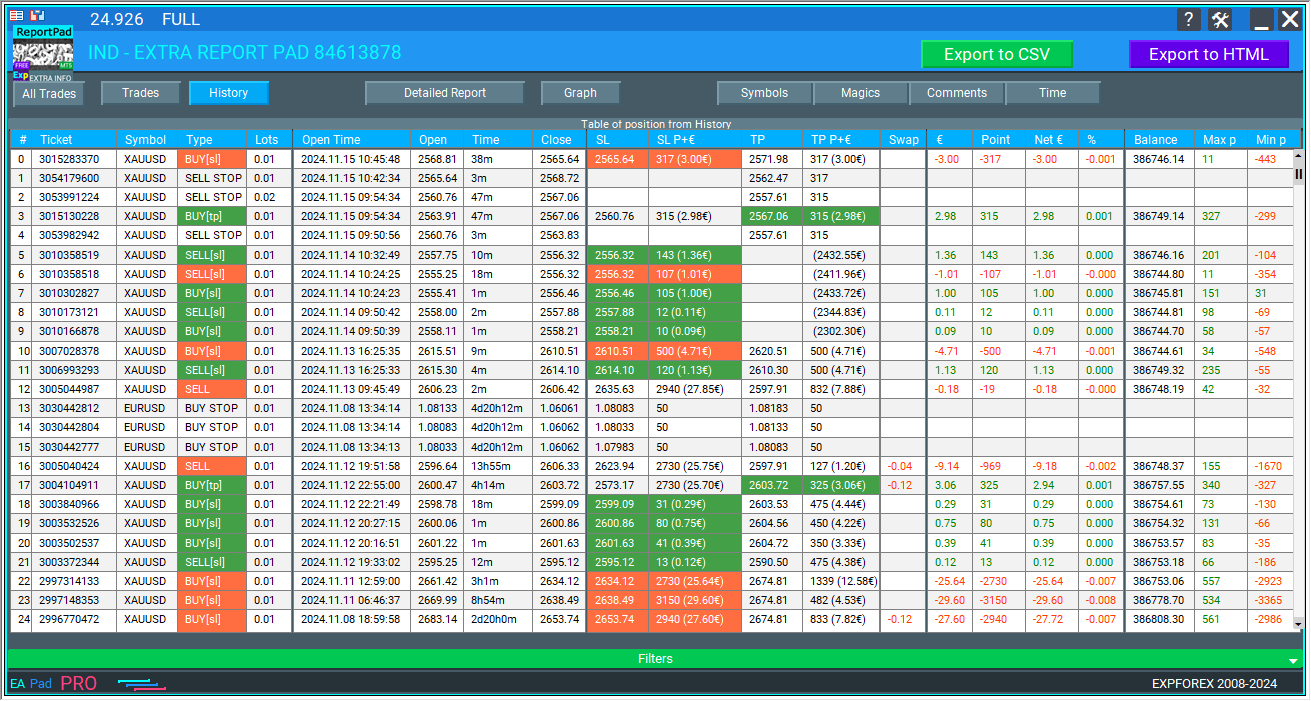
علامة تبويب ALL TRADES (جميع الصفقات)
تعرض علامة التبويب هذه كلاً من الصفقات المغلقة من السجل والصفقات المفتوحة الحالية.
يمكن أيضًا تعديل أسماء الأعمدة، وكذلك رؤيتها، في الإعدادات.
مماثلة لعلامتي التبويب TRADES (الصفقات) و HISTORY (السجل).
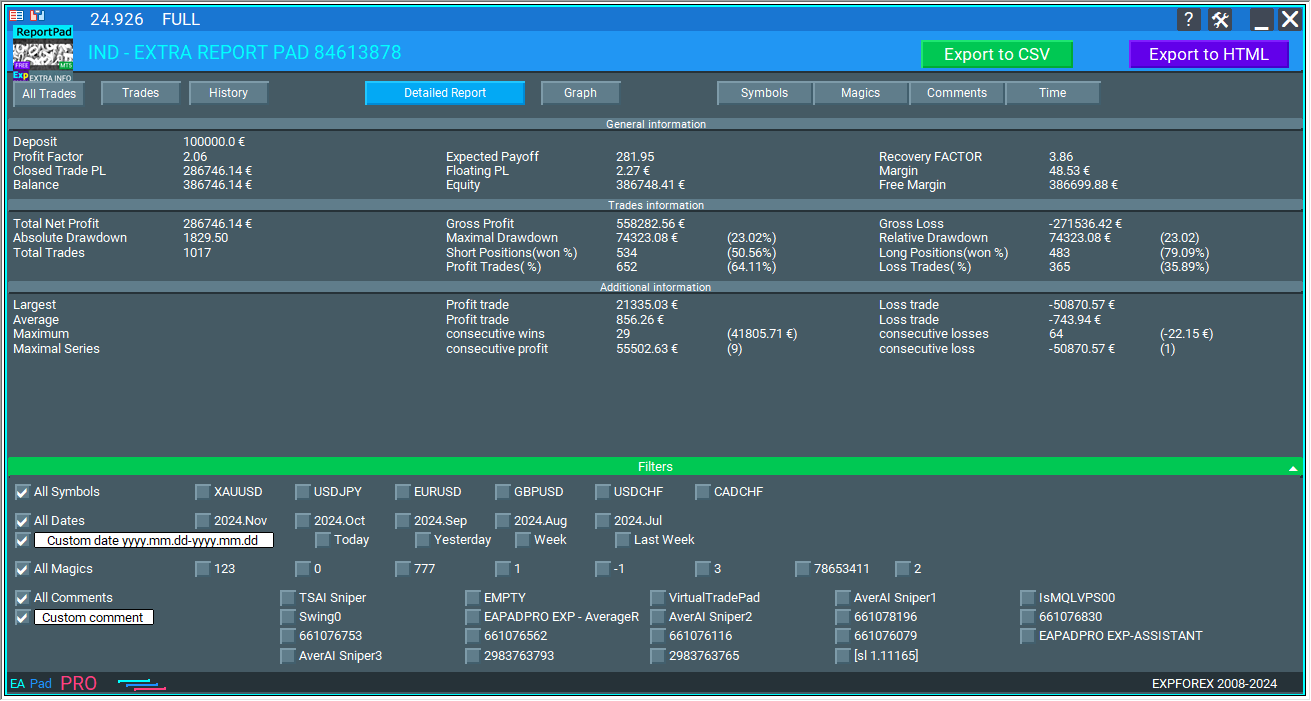
علامة تبويب REPORTS (التقارير)
تعرض علامة التبويب هذه إجمالي الإحصائيات المفصلة لحسابك.
يتم حساب البيانات الإحصائية باستخدام الصيغ الدقيقة المستخدمة في تقرير MT4.
يتم أيضًا حساب البيانات الإضافية باستخدام صيغ من مصادر أخرى (مثل MQL5).
يتم عرض جميع الإحصائيات في الوقت الفعلي (يتم تحديث المعلومات كل 10 ثوانٍ. يمكنك ضبط ذلك في الإعدادات).
يمكنك تصفية البيانات حسب الرموز والأرقام السحرية والتعليقات وتواريخ الصفقات:
تعرض علامة التبويب هذه الإحصائيات الأساسية التالية:
Gross Profit (إجمالي الربح) – الربح الكلي، مجموع الأرباح من جميع الصفقات الرابحة؛
Gross Loss (إجمالي الخسارة) – الخسارة الكلية، مجموع الخسائر من جميع الصفقات الخاسرة؛
Total Net Profit (إجمالي صافي الربح) – صافي الربح، يوضح الفرق بين إجمالي الربح وإجمالي الخسارة؛
Free Margin (الهامش الحر) – الهامش الحر المتاح حاليًا في حساب التداول؛
Profit Factor (عامل الربح) – نسبة الربحية بين إجمالي الربح وإجمالي الخسارة؛
Expected Payoff (العائد المتوقع) – التوقع الرياضي للربح، يتم حسابه باستخدام الصيغة التالية؛
Recovery Factor (عامل الاسترداد) – يُحسب كنسبة الربح المطلق إلى أقصى تراجع (Drawdown). كلما ارتفع عامل الاسترداد، زادت سرعة استرداد النظام بعد التراجع؛
Absolute Drawdown (التراجع المطلق) – الفرق بين الإيداع الأولي وأدنى قيمة للرصيد خلال عملية الاختبار؛
Maximal DrawDown (أقصى تراجع) – القيمة القصوى لـ (الذروة القصوى – الذروة الدنيا التالية)؛
تُظهر النسبة المئوية لأقصى تراجع نسبة أقصى تراجع إلى قيمة الذروة العليا المحلية المقابلة؛
MaxDrawDown% – (MaxDrawDown / MaxPeak) * 100%؛
Total Trades (إجمالي الصفقات) – العدد الإجمالي للصفقات التي قام بها الخبير خلال عملية الاختبار؛
Short Positions (Won%) (مراكز البيع (نسبة الربح٪)) – العدد الإجمالي لمراكز البيع (الصفقات) والنسبة المئوية لمراكز البيع الرابحة (مراكز البيع الرابحة / إجمالي مراكز البيع * 100%)؛
Long Positions (Won%) (مراكز الشراء (نسبة الربح٪)) – العدد الإجمالي لمراكز الشراء والنسبة المئوية لمراكز الشراء الرابحة (مراكز الشراء الرابحة / إجمالي مراكز الشراء * 100%)؛
Profit Trades (% of Total) (الصفقات الرابحة (٪ من الإجمالي)) – العدد الإجمالي للصفقات الرابحة والنسبة المئوية من إجمالي عدد الصفقات (الصفقات الرابحة / إجمالي الصفقات * 100%)؛
Loss Trades (% of Total) (الصفقات الخاسرة (٪ من الإجمالي)) – العدد الإجمالي للصفقات الخاسرة والنسبة المئوية من إجمالي عدد الصفقات (الصفقات الخاسرة / إجمالي الصفقات * 100%)؛
Largest Profit Trade (أكبر صفقة رابحة) – أكبر ربح بين الصفقات الرابحة؛
Largest Loss Trade (أكبر صفقة خاسرة) – أكبر خسارة بين الصفقات الخاسرة؛
Average Profit Trade (متوسط ربح الصفقة الرابحة) – متوسط ربح الصفقات الرابحة (إجمالي الربح / الصفقات الرابحة)؛
Average Loss Trade (متوسط خسارة الصفقة الخاسرة) – متوسط خسارة الصفقات الخاسرة (إجمالي الخسارة / الصفقات الخاسرة)؛
Maximum Consecutive Wins (profit in money) (أقصى عدد من الانتصارات المتتالية (الربح بالمال)) – أقصى عدد من الصفقات الرابحة المتتالية وإجمالي الربح من هذه السلسلة؛
Maximum Consecutive Losses (loss in money) (أقصى عدد من الخسائر المتتالية (الخسارة بالمال)) – أقصى عدد من الصفقات الخاسرة المتتالية وإجمالي الخسارة من هذه السلسلة؛
Maximal Consecutive Profit (count of wins) (أقصى ربح متتالي (عدد الانتصارات)) – أقصى ربح من سلسلة متتالية من الصفقات الرابحة وعدد الصفقات في هذه السلسلة؛
Maximal Consecutive Loss (count of losses) (أقصى خسارة متتالية (عدد الخسائر)) – أقصى خسارة من سلسلة متتالية من الصفقات الخاسرة وعدد الصفقات في هذه السلسلة؛
Average Consecutive Wins (متوسط الانتصارات المتتالية) – متوسط عدد الصفقات في سلسلة رابحة متتالية؛
Average Consecutive Losses (متوسط الخسائر المتتالية) – متوسط عدد الصفقات في سلسلة خاسرة متتالية.
علامة تبويب الرسم البياني
أدناه رسم بياني يوضح التغير في الرصيد.
انتباه! يتم إعادة رسم جميع البيانات إذا قمت بتغيير المرشحات حسب الرموز أو التعليقات أو الأرقام السحرية أو شهر الصفقة!
إذا كنت تريد رؤيتها بشكل منفصل لكل زوج عملات،
حدد مربع الاختيار المقابل، وسيتم تحليل البيانات لزوج العملات المحدد.
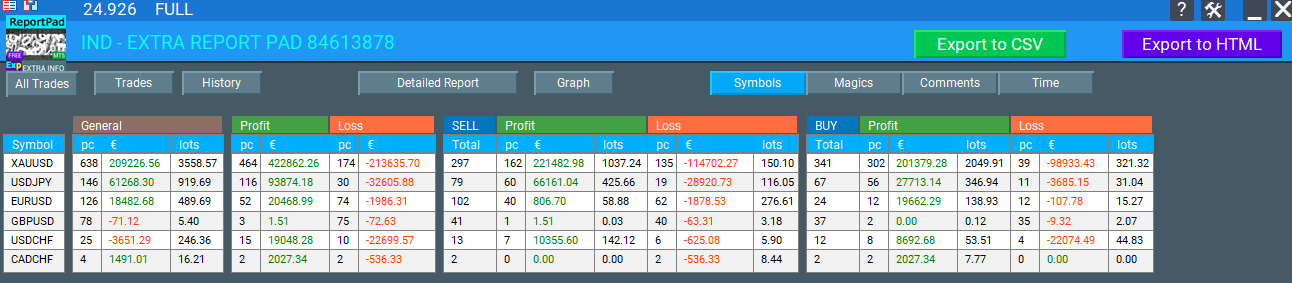
علامة تبويب DISTRIBUTION (التوزيع)
تعرض علامة التبويب هذه توزيع صفقات التداول حسب أزواج العملات والربح/الخسارة.
يعرض الجزء الأول عدد الصفقات المغلقة: صفقات الشراء وصفقات البيع. وضمن كل فئة، يعرض عدد الصفقات الرابحة.
يعرض الجزء الثاني الصفقات الرابحة بعملة الإيداع للشراء والبيع بشكل منفصل، ويعرض أيضًا إجمالي حجم العقد للصفقات الرابحة للشراء والبيع.
يعرض الجزء الثالث الصفقات غير الرابحة بعملة الإيداع للشراء والبيع بشكل منفصل، ويعرض أيضًا إجمالي حجم العقد للصفقات الخاسرة في صفقات الشراء والبيع.
علامة تبويب الرموز، الأرقام السحرية، التعليقات
تعرض علامات التبويب هذه البيانات الإجمالية حسب الرموز والأرقام السحرية والتعليقات.
الاستنتاجات
أثبت مؤشر Extra Report Pad لتحليل البيانات الإحصائية لحساب التداول أنه مريح جدًا في الاستخدام.
أثبت مؤشر تحليل البيانات الإحصائية لحساب التداول أنه مريح جدًا في الاستخدام.
لقد بذلنا الكثير من الجهد في تنفيذه.
شكرًا لك على قراءة المقال حتى النهاية.
يمكنك تنزيل مؤشري في قسم الملفات!
إذا كنت ترغب في شكر المؤلف على هذا المشروع – يمكنك النقر فوق زر شكرًا لك . أو شراء أحد منتجاتنا
ما هو Extra Report Pad؟
الإجابة: Extra Report Pad هو أداة احترافية مصممة لـتحليل حساب التداول الخاص بك بفعالية. يقدم تحليلًا إحصائيًا شاملاً في الوقت الفعلي، مما يسمح للمتداولين بمراقبة وتقييم أداء تداولهم بدقة أكبر مقارنة بالأدوات القياسية مثل MyFxBook.
كيف يُقارن Extra Report Pad بـ MyFxBook؟
الإجابة: بينما يوفر MyFxBook تحليلًا مباشرًا للرسوم البيانية لحسابات التداول، يقدم Extra Report Pad معلومات أكثر تفصيلاً وبنسبة 500% معلومات إضافية من خلال تقارير HTML الخاصة به. فهو لا يحلل الصفقات المفتوحة والمغلقة فحسب، بل يوفر أيضًا بيانات إحصائية متعمقة ورؤى حول الأداء الشهري، مما يجعله خيارًا متفوقًا للمتداولين المحترفين.
ما هي الفوائد الرئيسية لاستخدام Extra Report Pad؟
الإجابة: تشمل الفوائد الرئيسية لـ Extra Report Pad ما يلي:
التحليل في الوقت الفعلي: يوفر إحصائيات وبيانات محدثة.
التخصيص: يسمح بالتصفية حسب الرموز والتواريخ والأرقام السحرية والتعليقات.
سهولة الاستخدام: مدمج في منصة MetaTrader للوصول السلس.
الإحصائيات المحسنة: يقدم تحليلًا أكثر عمقًا مقارنة بالتقارير القياسية.
كيف يمكنني تصدير بيانات التداول الخاصة بي باستخدام Extra Report Pad؟
الإجابة: يسمح لك Extra Report Pad بتصدير بيانات التداول الخاصة بك بتنسيقي HTML و CSV. بالنقر فوق زر EXPORT to HTML، يمكنك إنشاء تقرير مفصل تمت تصفيته حسب المعايير التي اخترتها (على سبيل المثال، زوج عملات معين أو رقم سحري أو شهر). يتم حفظ الملفات المصدرة في دليل YOUR TERMINAL \ MQL4 \ Files \ EXTRAREPORTPAD، مما يسهل الوصول إلى أداء التداول الخاص بك ومراجعته خارج منصة MetaTrader.
ما هي أنواع المرشحات المتوفرة في Extra Report Pad؟
الإجابة: يوفر Extra Report Pad العديد من خيارات التصفية لتخصيص تحليلك:
التصفية حسب الرمز: حدد أزواج عملات معينة.
التصفية حسب التاريخ: اختر فترات تداول معينة.
التصفية حسب الرقم السحري: قم بتصفية الصفقات بناءً على الأرقام السحرية.
التصفية حسب التعليق: قم بفرز الصفقات حسب التعليقات.
التاريخ والتعليق المخصصان: أنشئ مرشحات مخصصة لتحليل أكثر دقة.
تساعد هذه المرشحات في عزل وفحص جوانب محددة من أداء التداول الخاص بك.
هل يمكن لـ Extra Report Pad التعامل مع عدة أزواج عملات في وقت واحد؟
الإجابة: نعم، تم تصميم Extra Report Pad لإدارة وتحليل عدة أزواج عملات في وقت واحد. يسمح للمتداولين بمراقبة عدة صفقات عبر أزواج مختلفة في وقت واحد، مما يجعله ضروريًا لاستراتيجيات التداول الحديثة التي تتضمن تداول عملات متعددة في وقت واحد. تبسط الأداة تعقيد التعامل مع العديد من الصفقات من خلال توفير بيانات إحصائية مفصلة ومنظمة.
ما هي اللغات المتاحة لـ Extra Report Pad؟
الإجابة: يدعم Extra Report Pad لغات متعددة لتلبية احتياجات قاعدة مستخدمين متنوعة. تشمل اللغات المتاحة ما يلي:
الإنجليزية
الأوكرانية
البرتغالية
الإسبانية
الإيطالية
الفرنسية
الألمانية
الصينية
اليابانية
الكورية
التركية
يضمن هذا الدعم متعدد اللغات أن يتمكن المتداولون من مختلف المناطق من استخدام الأداة بفعالية.
كيف يعزز Extra Report Pad تحليل الصفقات مقارنة بتقارير MetaTrader القياسية؟
الإجابة: تفتقر تقارير MetaTrader القياسية إلى البيانات التفصيلية حول الصفقات الفردية وأزواج العملات المربحة والإحصاءات الشهرية. يعالج Extra Report Pad هذه القيود من خلال توفير ما يلي:
بيانات مفصلة عن الصفقات: معلومات شاملة عن كل صفقة، بما في ذلك أوقات الفتح/الإغلاق والأسعار والربح/الخسارة والمزيد.
التحليل الشهري: يقسم أداء الصفقات حسب الشهر لتحليل أفضل للاتجاهات.
الإحصائيات المتقدمة: يحسب مقاييس مثل عامل الربح وعامل الاسترداد والتراجعات والمزيد.
التحديثات في الوقت الفعلي: يقوم بتحديث البيانات باستمرار كل 10 ثوانٍ، مما يضمن حصول المتداولين على أحدث المعلومات.
تمكن هذه التحسينات المتداولين من إجراء تحليل أكثر شمولاً واحترافية لأنشطة التداول الخاصة بهم.
هل Extra Report Pad سهل التثبيت والدمج مع MetaTrader؟
الإجابة: نعم، تم تصميم Extra Report Pad للاندماج السلس مع منصة MetaTrader. يتضمن التثبيت وضع ملفات المؤشر في دليل MQL4(5) \ Indicators. بمجرد التثبيت، تظهر الأداة كلوحة مدمجة داخل MetaTrader، مما يتيح سهولة الوصول إلى جميع ميزاتها دون تعطيل سير عمل التداول الخاص بك.
ما هي وسائل الدعم والموارد المتاحة لمستخدمي Extra Report Pad؟
الإجابة: يتمتع مستخدمو Extra Report Pad بإمكانية الوصول إلى العديد من وسائل الدعم والموارد، بما في ذلك:
وثائق شاملة: أدلة وتعليمات مفصلة حول استخدام ميزات المؤشر.
ملفات قابلة للتنزيل: ملفات مؤشرات يمكن الوصول إليها بسهولة متوفرة في قسم الملفات.
دعم العملاء: مساعدة لأي مشكلات فنية أو استفسارات.
موارد المجتمع: روابط لمنتجات ذات صلة وأدوات إضافية مثل VIRTUALTRADEPAD و EAPADPRO لتحليل تداول محسّن.
بالإضافة إلى ذلك، يمكن للمستخدمين التعبير عن تقديرهم بالنقر فوق زر شكرًا لك أو شراء منتجات أخرى، مما يعزز مجتمعًا داعمًا حول الأداة.
سجل التغييرات لـ Extra Report Pad (Changelog for ExtraReportPad)
ChangelogUpdate history will be loaded when this tab is opened.
Спасибо за индикатор! Премиальный дизапйн и очень мощная статситика !
Это тот лучший индикатор, котоырй должен быть у каждого пользователя и трейдера!!!
Мега респект
Reply from ExpForex:
Спасибо за отзыв. Приятно читать отзывы на свои программы. Это мотивирует и дальше делать качественные обновления по всем моим проектам.
This indicator is amazing. It also has the max upside watermark and the lowest drawdown that was in profit per trade. Compare it to the actual profit or loss, then use an EA like Account Protector and tell it to take profit or stop loss at the average high watermark and stop loss at at the lowest above the largest drawdowns. It will increase your profits and mimimize your losses. just review your trades daily or weekly and you will find this tool invaluable. And the reports are far better than Metatraders. And it gives you a report analysis of all your trades with win and lose rate, profit ration, lowest overall drawdown, etc. You can also filter your trades by comment or magic number to get a drilled down deeper insight. Great job author!
Very good reporting tool - could I ask that in the Export to HTML Magics section to add the comments column? That way it makes it easier to correlate the magic number to the specific EA or trade comment without having to cross match them manually another way.
overall good indicator, delivery valuable information. My only criticism is the CSV export can use some improvements or maybe change it to excel format where you can do much more, otherwise love it.
"Thank you for your feedback! We're glad you find the indicator valuable. Regarding CSV export, MQL only supports CSV format, but it is specifically structured for Excel compatibility. You can easily open it in Excel and work with the data as needed. Let us know if you have any other suggestions!"
The indicator is very intuitive and detailed, suitable for synthesizing long-term performance Hopefully the author can add functions such as: deleting comments, magic number in the indicator's filter list (because after a long time the number will exceed the screen), creating a chart showing Equity/Balance (profit/loss) of the account over time in history.
Jcb Mlwijk
Excellent reporting functionality that provides you with detailed insights into their trading performance. The tool generates trade history reports, including key metrics such as profit/loss analysis, drawdown, and risk exposure.
12 رداً على “لوحة تقارير إضافية – يوميات المتداول. تحليل احترافي لحساب التداول الخاص بك. MyFxBook في الرسم البياني المباشر. لوحة تقارير إضافية. Extra Report Pad”
Abel
I really appreciate the way you explain things. Thanks so much!
الوصف
لقد قمنا بتلخيص نتائج التداول الموجزة والمفصلة لخبرائنا TickSniper, Good Santa, Tick Hamster, The X, على حسابات التداول الحقيقية (real trading accounts) الخاصة بنا. إحصائيات…
We use cookies to improve your experience, analyse traffic, and personalise content. You can accept all cookies or customize your preferences.
Cookies are small text files that can be used by websites to make a user's experience more efficient.
The law states that we can store cookies on your device if they are strictly necessary for the operation of this site. For all other types of cookies, we need your permission. This means that cookies categorized as necessary are processed based on GDPR Art. 6 (1) (f). All other cookies, including preferences, analytics, and marketing cookies, are processed based on GDPR Art. 6 (1) (a).
This site uses different types of cookies. Some cookies are placed by third-party services that appear on our pages.
You can change or withdraw your consent at any time from the Cookie Declaration on our website.
Learn more about who we are, how you can contact us, and how we process personal data in our Data Protection Policy and Disclaimer.
Please state your consent ID and date when you contact us regarding your consent.


اترك تعليقاً